
Sequence of Returns Risk: Why the First Five Years of Retirement Matter Most
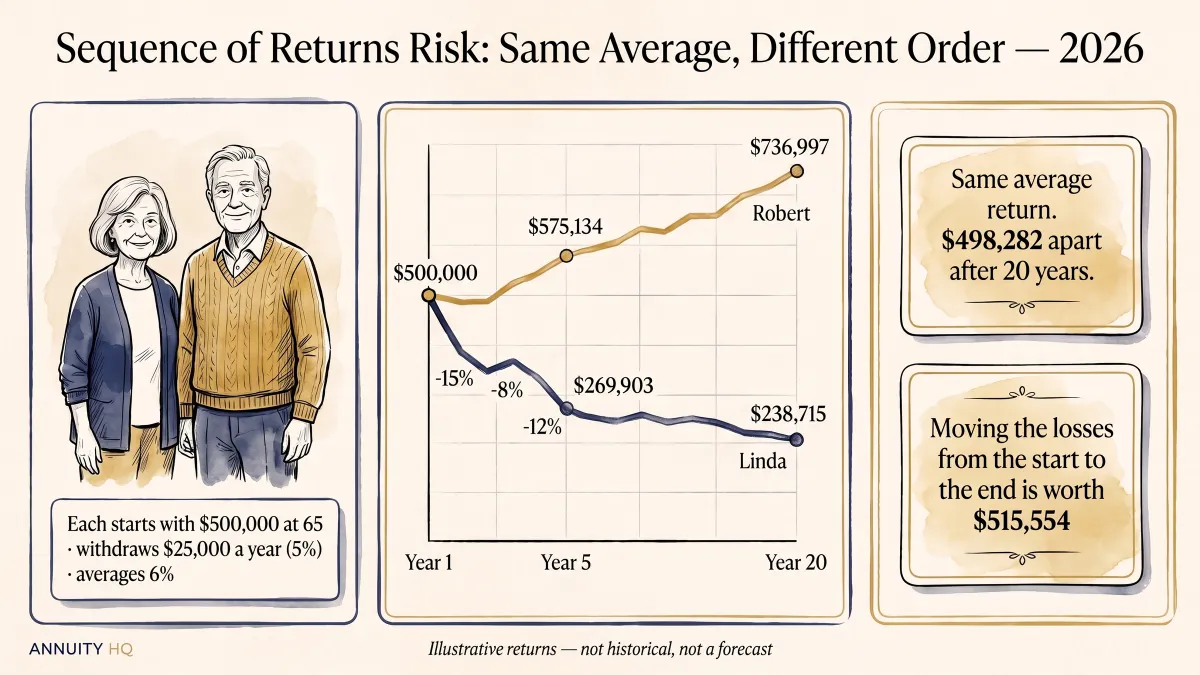
Two people retire the same year with the same savings. They spend the same amount, hold the same investments, and over twenty years they earn exactly the same returns. One of them finishes with three times as much money as the other.
That sounds like a trick. It is not. The only difference between them is the order in which the good years and the bad years arrived.
This is sequence of returns risk, and it is one of the least intuitive ideas in retirement planning. It barely matters while you are saving. It matters a great deal once you start taking money out — and it matters most in the first few years after you do.
Key Takeaways
The average return does not settle a retirement outcome on its own. Once withdrawals begin, the same returns in a different order can leave very different balances. [1]
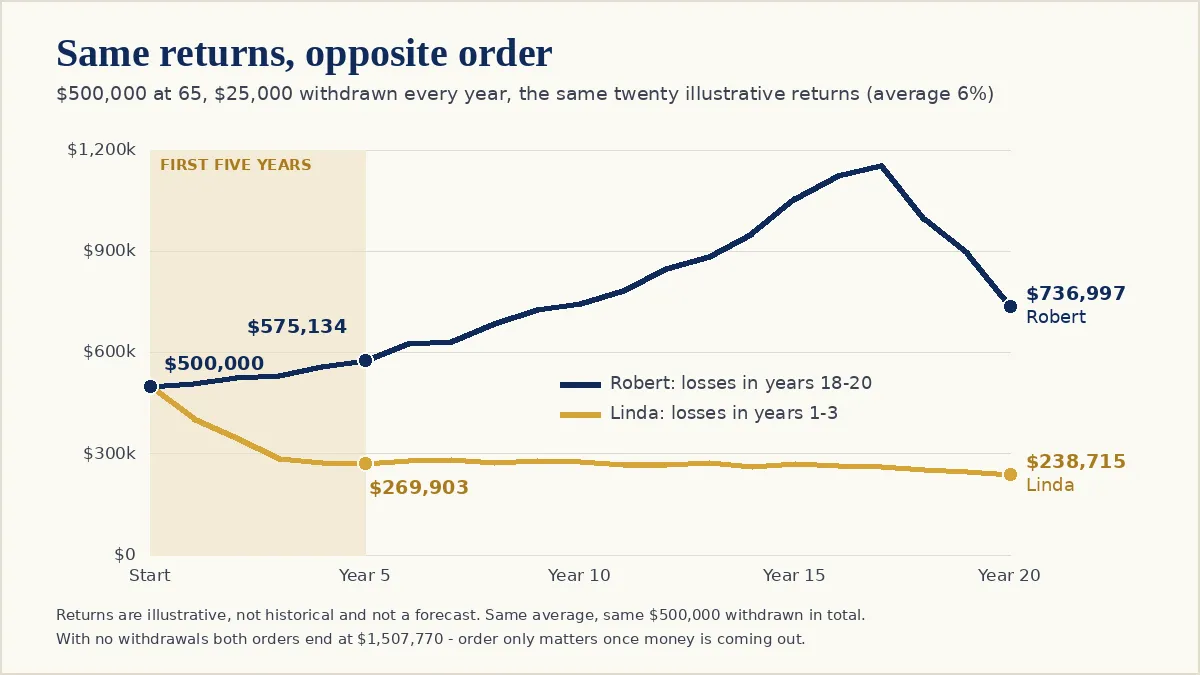
With no withdrawals, order makes no difference at all: in the illustration below, $500,000 grows to $1,507,770 whichever way round the same twenty returns arrive.
Take $25,000 a year from that $500,000 and the order changes everything. The retiree whose losses come first ends twenty years with $238,715; the one whose losses come last ends with $736,997.
The early years carry the most weight because losses and withdrawals compound together on a smaller base. The same three losing years cost the most in years one to three and the least in years eighteen to twenty.
The main things a retiree controls are the withdrawal amount, how flexible it is, and how the money is invested — and each comes with a real trade-off, not a free fix.
What sequence of returns risk actually is
Sequence of returns risk is the risk that the timing of market losses, rather than their size, damages a retirement. The Government Accountability Office put it plainly in its report on retirement income: "if the drawdowns begin after the value of the investments has declined, the income drawn would deplete a greater proportion of the investments than if growth had occurred before the income were drawn." [1]
The key word is drawdowns. Without them, the order of returns is irrelevant. Multiplication does not care about order — a 10% loss followed by a 10% gain lands in the same place as the gain followed by the loss.
You can see this in the example used throughout this article. Take $500,000 and apply twenty years of returns, three of them losses. Apply the same twenty returns in reverse. With nothing withdrawn, both routes end at exactly $1,507,770.
Now take money out every year and that symmetry breaks. Each withdrawal is a sale, and a sale made after a fall has to sell a bigger share of what is left. Those sold dollars are no longer there when the recovery comes.
That is the whole mechanism. Everything else in this article is about how large the effect is and when it is largest.
Why it bites once the paychecks stop
While you are working and adding money, a bad market early on is inconvenient but survivable. New contributions buy in at lower prices, and there are years ahead for recovery.
In retirement the arrows point the other way. Money is leaving, often on a fixed schedule, and it leaves whether or not the market has recovered. Falls are not rare, either. The SEC's investor education office notes that "large company stocks as a group, for example, have lost money on average about one out of every three years." [2]
The arithmetic of recovery works against a retiree too. In the example below, three losing years of 15%, 8% and 12% in a row leave 68.8 cents of every dollar, a fall of 31.2%. Getting back to even from there takes a gain of 45.3% — before counting any withdrawals.
The horizon is long, which gives an early setback plenty of time to compound. Under the Social Security Administration's 2023 period life table, used in the 2026 Trustees Report, a man aged 65 has a life expectancy of 18.12 more years and a woman 20.66. [3] Those are averages; many people live well beyond them. GAO noted that a married couple both aged 65 have about a 47 percent chance that at least one of them reaches 90. [1]
A plan built to last twenty or thirty years is therefore exposed to whatever happens first, for all the years that follow.
Same returns, opposite order: Linda and Robert
Here is the example in full. The returns are illustrative — invented for this article, not taken from any market history and not a forecast of anything. They were chosen to be ordinary: seventeen gains of between 5% and 14%, and three losses. The rules applied to them are simple arithmetic.
Linda and Robert both retire at 65 with $500,000. Each takes $25,000 at the start of every year, a 5% initial withdrawal, and never changes it. The remainder earns that year's return.
Linda's first three years are the losses: −15%, −8%, −12%. Then seventeen gains follow. Robert receives exactly the same twenty returns in reverse order, so his first year is Linda's last (+7%) and his three losses come in years eighteen to twenty.
Both earn an average of 6% a year. Both take out $500,000 in total. Only the order differs.
End of year | Linda (losses first) | Robert (losses last) | Gap |
|---|---|---|---|
Start | $500,000 | $500,000 | — |
1 | $403,750 | $508,250 | $104,500 |
3 | $284,636 | $531,847 | $247,211 |
5 | $269,903 | $575,134 | $305,231 |
10 | $278,135 | $744,465 | $466,330 |
15 | $269,793 | $1,057,333 | $787,540 |
20 | $238,715 | $736,997 | $498,282 |
Three things stand out.
The damage is done by year five. Linda enters her sixth year with 54.0% of what she started with. Robert has more than he started with. Linda then gets seventeen straight years of gains — and her balance barely moves, because the $25,000 she withdraws each year is roughly what those gains produce on a smaller base.
The same withdrawal becomes a different burden. Entering year six, $25,000 is 9.3% of Linda's balance but 4.3% of Robert's. They are spending the same dollars; one of them is spending a much larger share of the account.
Robert's losses still hurt — they just hurt later and less. His balance peaks at $1,155,256 at the end of year seventeen and then falls to $736,997 as the losses arrive. By then he has fewer years left for the money to cover, and a much larger cushion to absorb it. At the end of twenty years he has about 3.1 times what Linda has.
Size it for your own situation. The Retirement Income Gap calculator at Annuity HQ sets your planned spending against your guaranteed income and savings, and shows how large a withdrawal your plan depends on each year. That withdrawal is the number sequence risk works on — the larger it is relative to your savings, the more a bad start costs.
Why the first five years, specifically
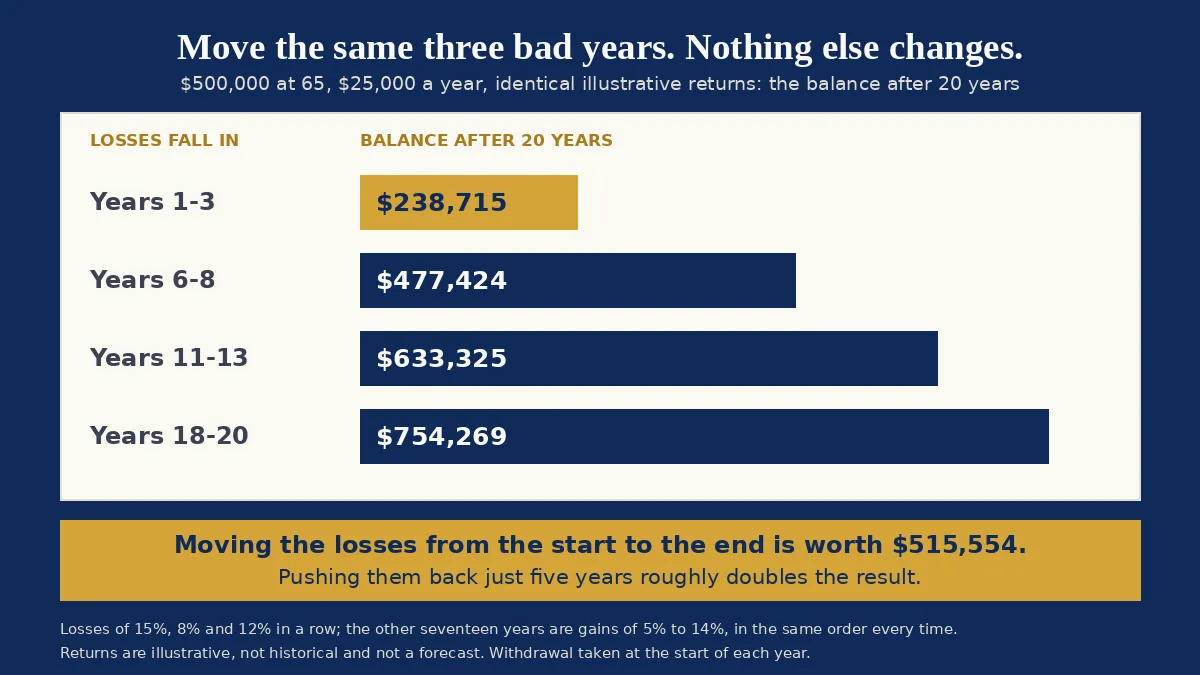
The table compares the two extremes. A cleaner way to see why timing matters is to keep everything fixed and move only the three losing years.
Using the same seventeen gains and the same three losses, same $500,000 and same $25,000 a year, here is where Linda would finish after twenty years depending on when the losses arrive:
Losing years fall in | Balance after 20 years |
|---|---|
Years 1–3 | $238,715 |
Years 6–8 | $477,424 |
Years 11–13 | $633,325 |
Years 18–20 | $754,269 |
Every row has identical returns and identical withdrawals. Moving the same three bad years from the start to the end of the twenty is worth $515,554.
The effect is steepest at the front. Pushing the losses back just five years, from years one to three to years six to eight, roughly doubles the ending balance. That is why planners talk about the years around the retirement date as the risky stretch: a loss there hits the largest number of future withdrawals, on a balance that has not yet had a chance to grow.
The GAO report shows the same pattern with its own illustration. It took returns of +7%, −13% and +27% repeating — an average of 7% — against the same returns with the second and third years swapped, and a deliberately high 9% withdrawal from $100,000 at 65. The first order lasted 18 years and the second 24, with the average return identical. [1] Six years of income came down to nothing but order.
The levers a retiree actually has
Nobody can choose the order of their returns. What a retiree can influence is how exposed their plan is to a bad order, and every lever costs something. The point here is to show the trade, not to pick one.
The size of the withdrawal. This is the most direct lever. In the example, cutting the withdrawal to $20,000 a year, 4% of the starting balance, leaves Linda with $492,526 after twenty years and Robert with $891,151. Raising it to $30,000, 6%, means Linda cannot make her full twentieth-year withdrawal — she has $15,891 left entering that year — while Robert still ends with $582,842. The cost of a lower withdrawal is obvious: less to live on in every year, including all the years when the market is fine.
GAO's report cites Congressional Research Service estimates built on historical returns for a portfolio of 35% stocks and 65% corporate bonds. A 4% initial withdrawal was estimated to last 30 years or more 94.0% of the time, 5% 77.0% of the time and 6% 49.5% of the time. [1] GAO is explicit that "there is no assurance that future investment returns will match historical returns." [1] The experts it interviewed suggested first-year withdrawals in a range of 3 to 6 percent, adjusted for inflation afterwards. [1]
Flexibility in the withdrawal. Linda's problem is partly that she keeps selling $25,000 through the worst years. A retiree who can take less after a fall sells fewer shares at low prices. The cost is that spending becomes less predictable, and many retirement expenses are not flexible at all.
How the money is invested. The SEC's investor education office observes that someone who will need to withdraw money soon, including for living expenses in retirement, "may want to consider more conservative investments since you may not have a lot of time to wait for a market rebound." [4] The trade is the other side of the same coin: less exposure to a bad start usually also means lower expected growth over a retirement that can last decades.
Income that does not depend on the market. The larger the share of spending covered by income that arrives regardless of markets — Social Security, a pension — the smaller the withdrawal that has to come from investments, and the less a bad sequence can do. Each source has its own costs and conditions, which other Annuity HQ articles work through; none of them is free.
One lever is not fully under a retiree's control. Required minimum distributions from traditional IRAs and most workplace plans generally begin at age 73, and each year's amount is the prior 31 December balance divided by an IRS life expectancy factor. [5] That withdrawal has to be taken whether or not the market has recovered, although what is done with the money once it is out is a separate choice.
What this example cannot tell you
The returns are made up. They were chosen to be plausible and to make the mechanism visible, and they say nothing about what markets will do. Real sequences are messier, and nobody knows in advance which one they will get.
The withdrawal is flat. Real spending tends to rise with prices, which makes the effect of a bad start larger than shown here, not smaller. Taxes, fees and the difference between account types are all left out.
And the example looks at one retiree at a time, with one pot of money. A household with a pension, two Social Security benefits and savings in several accounts has more room to choose which pot to draw from in a bad year — which is itself a way of managing the risk, and one that depends entirely on individual circumstances.
What the example does show is that "what will my average return be?" is only half the question. The other half is "how much am I taking out, and what happens if the bad years come first?" That second question has a number attached, and it can be run.
Run your own first five years. The Retirement Income Gap calculator at Annuity HQ works out the gap between the income you will have and the income you plan to spend — the amount your savings will be asked to supply every year. Run it at the spending you intend, then at a lower figure, and see how much of your plan rests on the withdrawal holding up through a poor start.
Frequently Asked Questions
If my average return is the same, how can I end up with less? Because withdrawals turn a multiplication into something order-dependent. Without withdrawals, the same returns in any order give the same result — in this article's example, $1,507,770 both ways. With withdrawals, money taken out after a fall sells a larger share of the account, and those dollars miss the recovery. GAO describes exactly this: drawdowns after a decline "deplete a greater proportion of the investments." [1]
Does sequence risk matter while I'm still working? Much less. While you are adding money rather than removing it, early losses mean new contributions buy in at lower prices. The risk becomes significant when the direction reverses and withdrawals begin, which is why the years just before and after the retirement date get the most attention.
Why do people say the first five years matter most? A loss early in retirement shrinks the balance that every later withdrawal and every later gain is built on. In the example, moving the same three losing years from years one to three to years six to eight roughly doubles the ending balance, from $238,715 to $477,424. Later losses still cost money, but they hit a larger balance with fewer withdrawals left to fund.
Is a 4% withdrawal rate safe from this? No withdrawal rate removes sequence risk; lower rates reduce how much damage a bad start does. Congressional Research Service estimates cited by GAO put the chance of a 4% initial withdrawal lasting 30 years or more at 94.0% on historical returns, falling to 77.0% at 5% and 49.5% at 6%. [1] Those figures rest on the past, and GAO notes there is no assurance future returns will match it. [1]
Can I tell whether I'm in a bad sequence while it's happening? Only in hindsight. The first few years of Linda's retirement and Robert's look completely different, but at the time neither of them could know what the next seventeen years would bring. That uncertainty is the reason the question is usually approached through the size and flexibility of the withdrawal rather than through predictions.
Source Links
Figures checked 27 September 2026. The worked example uses illustrative returns, not historical or forecast returns. Life tables and required-distribution rules are updated periodically — confirm current figures before relying on them.
1. U.S. Government Accountability Office — GAO-11-400, Retirement Income: Ensuring Income throughout Retirement Requires Difficult Choices (June 2011) The definition of sequence risk quoted in the article; the +7%/−13%/+27% illustration lasting 18 years against 24 years at a 9% drawdown; the CRS estimates of 94.0%, 77.0% and 49.5% for 4%, 5% and 6% withdrawals lasting 30 years or more; the 3 to 6 percent range from experts; the 47 percent chance that one of a couple aged 65 reaches 90; and the statement that future returns may not match historical ones.
2. U.S. Securities and Exchange Commission, Investor.gov — Beginners' Guide to Asset Allocation, Diversification, and Rebalancing That large company stocks as a group have lost money on average about one out of every three years.
3. Social Security Administration, Office of the Chief Actuary — Actuarial Life Table The period life table for 2023, as used in the 2026 Trustees Report: life expectancy at 65 of 18.12 years for men and 20.66 years for women.
4. U.S. Securities and Exchange Commission, Investor.gov — Don't Panic, Plan It! That investors who will need to withdraw money soon, including for living expenses in retirement, may want to consider more conservative investments because they may not have time to wait for a market rebound.
5. Internal Revenue Service — Retirement plan and IRA required minimum distributions FAQs That required minimum distributions generally begin at age 73, and that each is the prior 31 December balance divided by a life expectancy factor.
This article is educational and is not investment, tax, legal or insurance advice. The returns in the worked example are illustrative only and do not predict future results; outcomes depend on individual circumstances, and investments can lose value.
 | Jack Whittaker Jack writes the retirement education material at Annuity HQ from Mooresville, North Carolina, drawing on four decades of work with people making income, tax and Medicare decisions at retirement. |
